McDonald’s has used data to shorten customer wait times and create greater transparency throughout their business.

Jacob Hansen is the Head of Finance for Food Folk, the company that McDonald’s in the Nordics.
A core principle of the McDonald’s customer experience is the ease and speed of ordering and receiving a meal. But for a restaurant with a menu of over 100 items, delivering on this promise requires that the entire restaurant runs like a well-oiled machine. Each employee must know their exact role, and every part of the process needs to run seamlessly, starting with the customer placing an order, the food being prepared, drinks poured, and the meal packed in tray or bag, before finally being delivered to the customer.
Delicious, tasty meals, a large selection and fast service – this is what customers expect when visiting McDonald’s – but delivering demands optimized processes from end to end.
I knew that there had to be a better way to share data, like creating dashboards with real-time data
Can we get more out of our data?
Jacob Hansen and Food Folk had a mission to help McDonald’s Danish franchisees and Restaurant Managers to use their data to create an even better customer experience.
The good news for Jacob Hansen was that McDonald’s has been relatively good at collecting data from their thousands of daily customer interactions; now they just needed to find a way to present their data in an easy and accessible way – making the data come alive in the organization.
“First, we didn’t have an effective way to share data,” tells Jacob Hansen. “We created manual reports in Excel that were sent by email. I knew that there must be a better way to do it, like creating dashboards with real-time data.”
“Secondly, we could use our data even better.” He continues, “There was the potential to get an even better overview of the business and optimize it.”
McDonald’s continuously adapts their business in order to deliver the best food and service to customers. With dashboards, restaurant managers can easily follow that development, and ensure both quality and speed.
What is great? Benchmarking against other restaurants
The first step McDonald’s and Devoteam Data Driven took together was building a collection of interactive dashboards in Tableau that covered what both used to be shown in the manual reports, as well as a host of new data that was previously unavailable. The reports contain a number of advantages for the company:
- Dashboards are updated automatically – there is no more waiting on manual reports, and consistency and quality is always ensured.
- All Restaurant Managers are given access to the dashboards and can follow the status of their own restaurant and how it compares to others.
- Previously hard to access data can now be used as a benchmark for the performance at each restaurant, creating a clear picture of which restaurants possessed valuable experience for other restaurants to learn from.
- Because the dashboards are interactive, each restaurant can “zoom in” on the data points that are most relevant to them. The dashboards also enable data granularity that was not previously possible with the manual reports, giving restaurant or franchise managers a tool to precisely identify where future problems might lie.
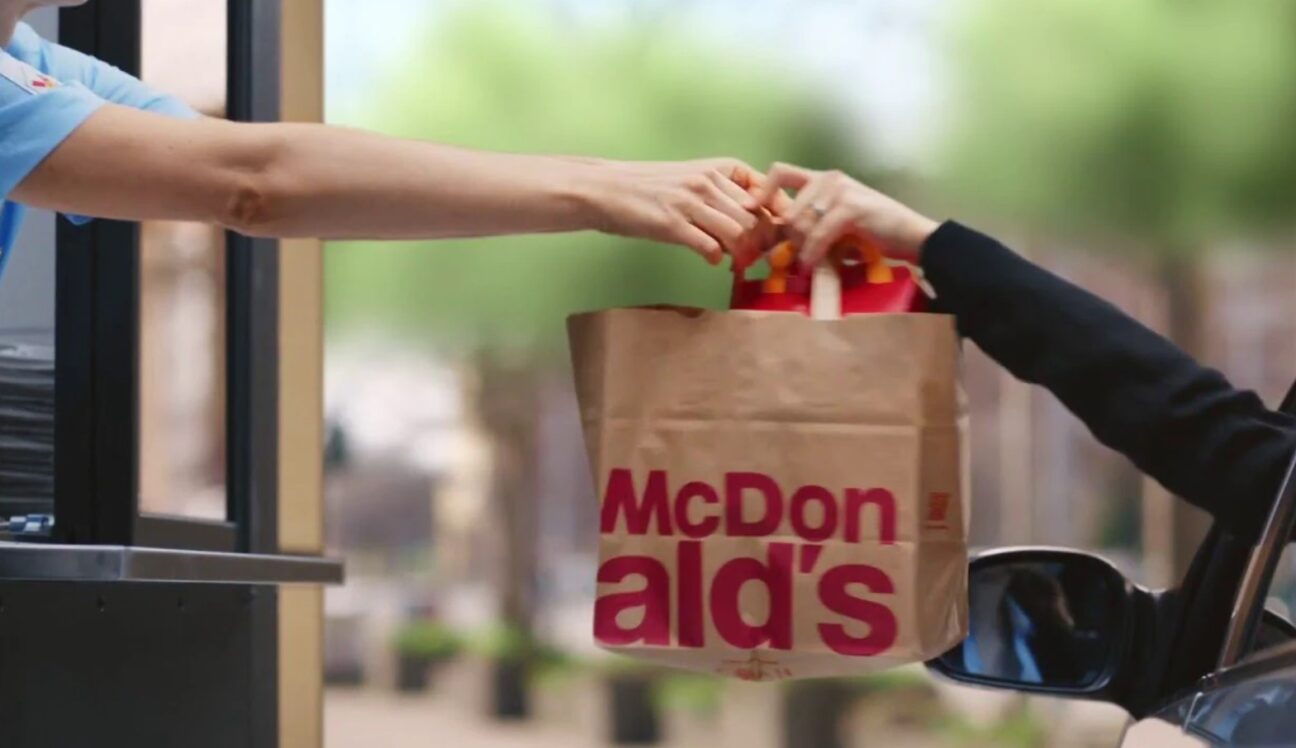
The COVID-19 pandemic has increased the Danes appetite for takeaway. Consequently, McDonald’s has experienced a steep increase in their drive-through traffic, and it has become even more essential to ensure fast and correct service to customers.
Shorter waiting in restaurants and drive-through
An example of how data has helped McDonald’s improve in the KPI called ‘speed of service’. This is a measure of the time it takes from when an order is registered, until the meal is delivered to the customer.
Speed of service was one of the data points that was not possible to see before working with Devoteam Data Driven. Head of Finance, Jacob Hansen explains:
“Before we got the dashboards, the Restaurant Managers could not see ‘what is great’. Maybe they knew their own speed of service at a high level, but when they could not compare with other restaurants, it was of little worth to know.”
When they were able to access the new data in interactive dashboards, it gave a completely new opportunity to see how a single restaurant is performing in relation to the others on a specific point. Jacob Hansen continues:
“Now they can see how they are performing compared to the other restaurants. But what is even more important is that they can now click through the dashboards and find out why their speed of service is different than expected. Now they can easily zoom into e.g. the point of the day when service is not as fast as expected, or the time of the week when it happens. It means that they can now see when the problems start and launch solutions that are within their own circle of influence.”
The possibility to diagnose problems and pinpoint precisely when they originate has led to McDonald’s restaurants throughout Denmark improving their average speed of service by 6% and increasing drive-through customers served per hour by 20% in 2020; impressive results in a year where restaurants’ operations have fundamentally changed due to COVID-19.
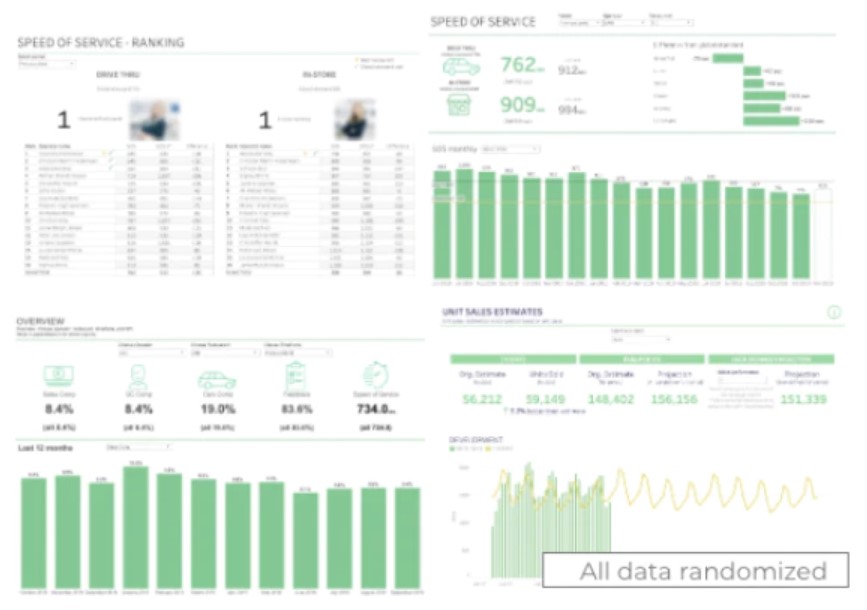
With dashboards like these, restaurant managers have the opportunity to deep-live into the data and see their current service level and how it compares to other restaurants. It makes it possible to identify problem areas, contributing to an average speed of service improved by 6% and enabling 20% more customers an hour to be serviced by McDrive compared to 2019.
Now we act more on facts and less on gut feeling
Dashboards on the walls
McDonald’s has a strong performance culture. Among the employees there is a focus to always deliver service of the highest quality – and be the best at doing it. Therefore the introduction of these dashboards has fit in well with the company culture. At a few of the restaurants Jacob Hansen has visited, the dashboards have crossed from the digital to physical world, printed and hung up on the wall in the break room as motivation to be the top restaurant.
“The dashboards have a strong motivation effect, there is no doubt about it,” tells Jacob Hansen. “Now we act more on facts and less on gut feeling, and we can see that the whole organization has really taken to it, the dashboards have been viewed over 100.000 times already. We are just getting started working with data and creating transparency in our business. We have come a long way, but there are still so many ways we can go from here.”
About working with Devoteam Data Driven
The open and curious approach to data has been important to Jacob Hansen and Food Folk during this process. “We have worked very closely with Devoteam Data Driven, in a process where we have constantly been scoping and prioritizing, and becoming wiser about our possibilities”, he says. “That is much better than a process where we order something and the consultants come back with a report 3-6 months later.”
If you want to see what Devoteam Data Driven can do to optimise your business, please don’t hesitate to contact us or book a phone meeting with one of our data experts on the button below:

